A few of the reporting types available - comparison line graph, pie chart, and dwell heatmap.

User Facing Components Overview >
Review Spotlight: Intro > Live View > Events View > Search Events View > Archive Video View > Reports View > Tracks & Heatmap View
The intuVision Review is an all-inclusive monitoring application with myriad of features to view video, events and alarms, access and report the results generated by intuVision Video Analytics. It features multiple review and reporting options, query and search customization, and full user management tools.
Commonly, users of the Review Application fall into two categories: live event or video review (typically for security applications), or data management (looking at data trends, counts, usage statistics, etc.).
With the intuVision Review you can:
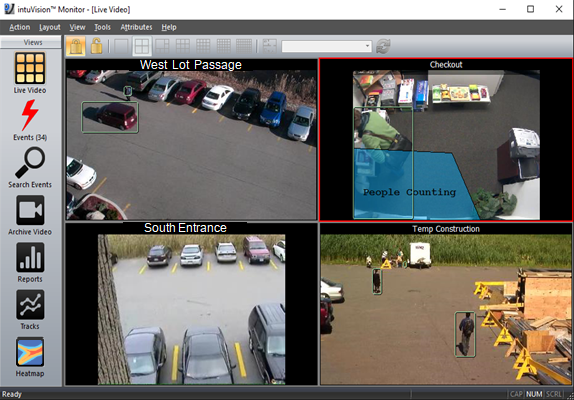
Watch live video with processing markups such as object bounding boxes, event zones, see up-to-date counts and flashing red frame indicating unreviewed alarm events on that camera. Choose from different camera layouts, view up to 48 cameras on one screen. Optionally, pause video analytics processing for a preset duration or add privacy masks to the camera view while the processing continues.
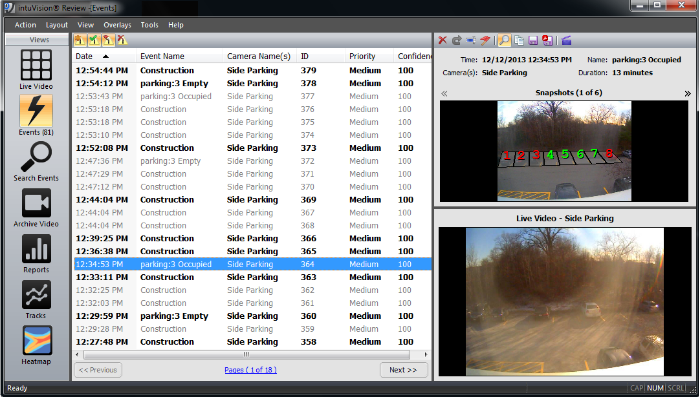
Access and review events detected by intuVision VA. You will see the list of events, when one is selected, you can see the event snapshot images and event details, along with the current live video from that camera. Events can be acknowledged, flagged, event descriptions can be added or deleted. Optionally, events and event snapshots can be exported and shared.
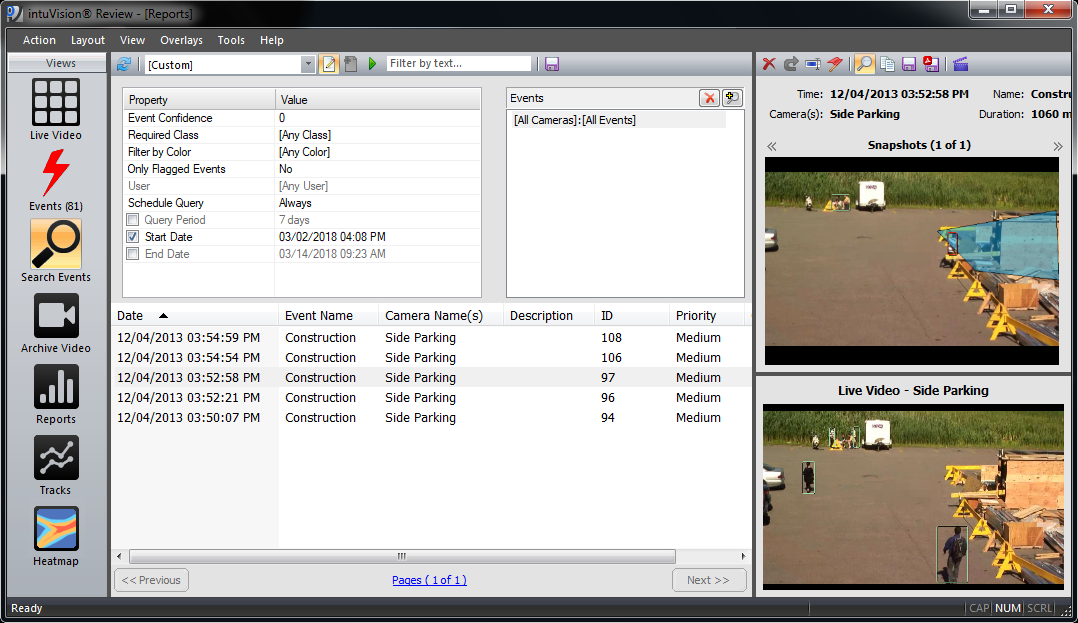
Events can be searched with camera name, event type, and time period or specific criteria such as object classification type, keywords in event description and set schedules. The retrieved events can be reviewed, with the event snapshot and event details available. Events can be exported as .pdf a CSV for further analysis in 3rd party dashboard applications.
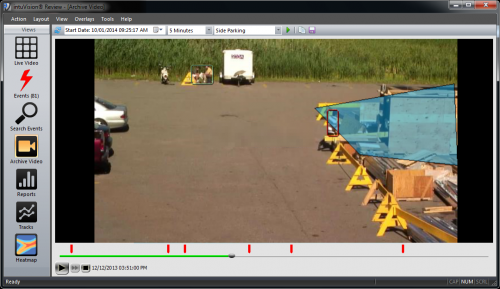
intuVision VA can archive video and also can ingest archived video from one of our integrated VMSs with searching for the video duration of interest, and viewing an "events only" summary. Bounding boxes for all objects are overlain in the recorded video - giving a powerful tool for analysis and ensuring ideal optimization.
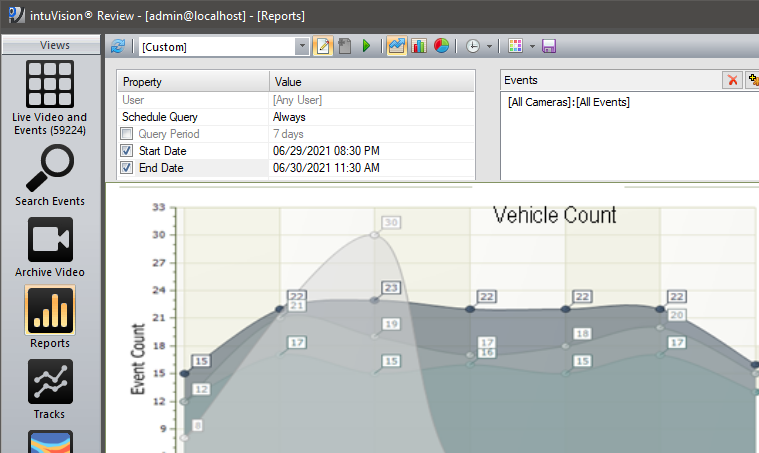
Detected events can be used to generate reports in various formats. Events can be reported in various chart formats such as line and bar graphs and pie charts ready to export and share with others. Additionally, typically used in retail or traffic domains, the comparison graph feature allows comparing events from different periods this year vs. previous years or weekdays vs. weekends to show efficacy of new work or traffic flow measures.
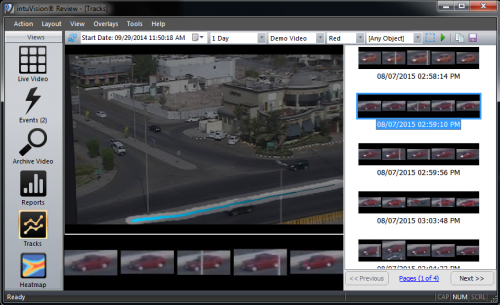
intuVision VA has the capability to save, search and review object tracks. Using this feature objects can be searched by camera name, time period or specific criteria such as object color and classification type. The retrieved objects are presented in a convenient list with thumbnail images for the user to select and inspect. When an object is selected, the path it took through the scene is displayed. If video archiving has also been enabled, the video associated with that object can also be reviewed.
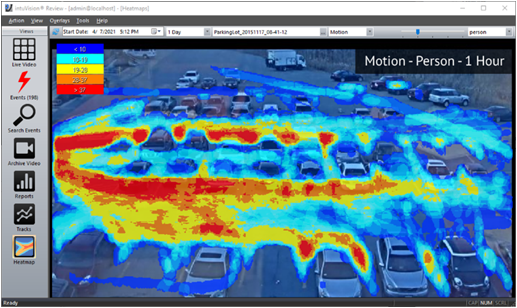
intuVision VA's motion and dwell heatmaps summarize vehicle or pedestrian traffic patterns over selected time periods. As more objects travel on a path or pause for various durations, the heatmap reflects these actions. Used in a traffic scenario, these provide at a glance information where the bottlenecks are to change the traffic light patterns accordingly; or establish walking paths for people in parks. Similarly, in a retail environment, heatmaps reveal which sale items attract the shoppers' attention and which paths are most commonly taken through the store.
Keep an eye out for future blog posts in this series, detailing how each of these views and capabilities can work for you!

© Copyright 2006-2026 intuVision, Inc. All Rights Reserved. intuVision is registered in the U.S. Patent and Trademark Office.