Search Events:
Heatmaps are an add-on feature, compatible with all intuVision VA modules.
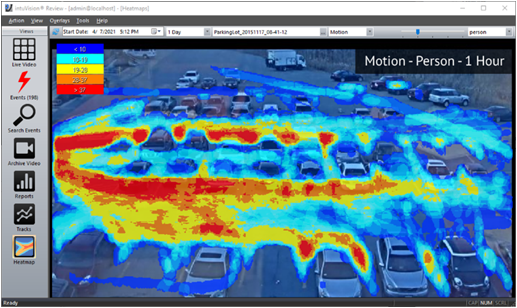
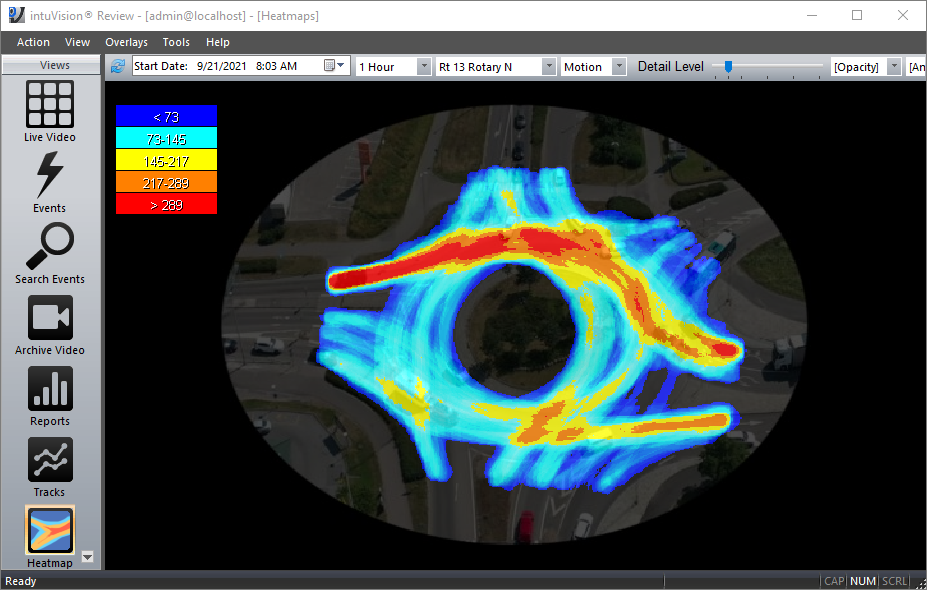
Using the tracks of moving objects, the heatmaps show general motion or dwell patterns in a scene over a selected time period at-a-glance. Compressing all activity in the scene to an easily understood color coded display, heatmaps provide a powerful visual tool for understating the movement trends and an overview of the scene activity. For example, heatmaps may show the most popular paths throughout a store or busiest origin-destination directions in an intersection highlighting areas for investigation.
intuVision VA and intuVision Edge provide two types of heatmaps, Dwell and Motion Heatmaps. As implied by their names, the Dwell Heatmaps highlight areas where people or vehicles stop and linger in the scene, for instance to examine a display in a store, or stopped to wait for a left turn. The Motion Heatmaps highlight the activity trends in the scene, showing the low to high numbers of objects travel.
Heatmaps can be created for a selected camera, date/time, duration, object classification type, and confidence. For an intersection camera it is possible to generate a heatmap looking for only vehicle motion during rush hour, and another looking only at pedestrian movement during lunch time.
In the manufacturing domain, heatmaps can track common paths taken throughout the shop floor, both by people & machinery such as forklifts. A motion heatmap showing these can reveal inefficiencies, for instance if employees are walking out of their way to access a machine or storage cabinet, or highlight unsafe paths taken by forklifts.
In the retail domain, both motion and dwell heatmaps are used to track paths that customers take throughout the store and areas where they stop and linger. When separated by classification type, motion heatmaps can reveal information such as if people with shopping carts are unlikely to travel in certain areas. Dwell heatmaps can be used to track where people spend time, highlighting the difference between end-cap displays or the relative use of multiple self-service stations.
In the traffic domain, heatmaps are used to track paths and wait times of vehicles & pedestrians. Leveraging object classification, separate heatmaps can be generated for trucks, motorcycles, pedestrians, passenger vehicles, routes typically taken by different types of vehicles or highlighting areas of people J-walking . Dwell heatmaps can showcase the relative traffic bottlenecks throughout the day, showing how far back from a stop sign vehicles are waiting throughout the day.
In the security domain, motion and dwell heatmaps can emphasize areas where there is a lot of people activity or people tend to stop and linger during the day and also after hours.
Optional settings are available to fine-tune the heatmap, including:
Heatmaps can be exported as images or saved as a PDF, for easy sharing and inclusion in reports.

© Copyright 2006-2026 intuVision, Inc. All Rights Reserved. intuVision is registered in the U.S. Patent and Trademark Office.