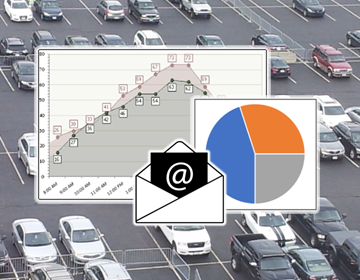
The intuVision Review Application features robust data visualization features, to see and export patterns within your data, but our newest versions also include the ability to automate those, sending reports directly to appropriate email addresses. This tool lets you see general behavior patterns in your scene and generate reports, and automate delivery of the reports to key personnel.
intuVision VA supports multiple report and graph formats to efficiently provide the information of interest. Detected events from any camera, or a group of cameras, over select time periods or object types can be seen; and comparisons can be made for any camera over different time periods.
Report types available include line graph, bar graph, and pie chart.
These features are widely used in data-drive deployments such as those typically found in retail or traffic applications, in order to generate reports of customer counts, and pedestrian or vehicle traffic patterns. This can also be helpful in seeing the general trends in security applications, such as when intrusion alerts are most likely to occur, or to evaluate the efficacy of certain measures on parking infractions.
Emails can be configured by camera and event, by object classification, schedule, and more. Customizable query and search parameters include:
- Camera and Event Name - reports can include all events on a specific camera, events across multiple cameras, selections of specific events, etc.
- Aggregate Events Period - data can be aggregated into time periods to see more granular data. Different aggregate periods include: none, 15 minutes, hourly, and daily.
- Separate Classes - instances of the same event can be reported separately based on the classification of the objects - for instance you can see average speed of different types of vehicles with one event.
- Schedule Query - return only events which were generated in a specific schedule - i.e. after hours or during lunch breaks.
- Query Period - how many days (starting from present time) into the past you would like to query events.
From seeing average speed over time, to the parking duration in each of your parking spots, these visualization tools delve into the information specific to each use case to view the data collected by specific events. intuVision VA report types include:
- Event Count - standard report type, creates a report based on the number of times each of the selected events has occurred over a time period.
- Average Activity - available only with "Activity" events, and generally used to monitor crowd status or customer status; this report shows on average how many people or other moving objects of interest were present in the scene over a time period.
- Average Dwell Duration - available only with "Dwell" events, this report shows how often people were dwelling or loitering in different marked areas. A common use example is to gauge how effective a display is at catching people's attention.
- Average Parking Duration - available only with "Parking" events, this report shows the average time each parking spot is occupied, indicating general parking distribution, and most frequently used spots, as well as areas of the parking lot used sparsely.
- Coverage Time - available only with "Activity" events, this report provides the time percentage of activity is present in a scene at different times and can be used to judge how often there are guests at your store - or even coverage time of your employees at their station.
- Merged Event Count - this report indicates how many events are grouped together in a merged events over time. Merged events generate one alarm for multiple instances of an event within a short period of time, for instance in scenes where only one alert is needed for a group intrusion.
- Parking Duration - available only with "Parking" events, this report gives the duration vehicles were parked in parking spots.
- Response Time - tied in with our user management tools, this reports average how long staff take to respond and review events as they occur.
- Speed - available only with "Speed" events, this report provides the average speed of vehicles and other moving objects in the scene over time. As with all reports, this can be further separated by vehicle classification type, for example giving average speed for passenger cars, trucks, motorcycles, etc.
You can contact us at info@intuvisiontech.com or call to learn more about how intuVision VA and find out how it could fit into your work flow needs.
