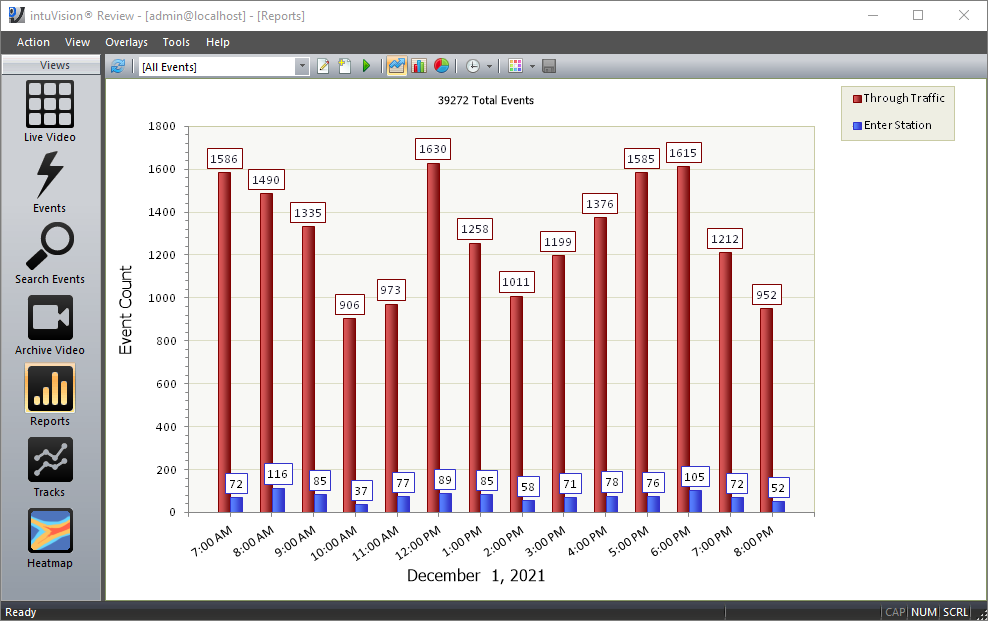
Bar graph from intuVision VA showing the vehicles entering the gas station vs those passing by the gas station, over the course of 12 hours.
intuVision VA Traffic was used to collect capture rate information of vehicles passing by a gas station vs those stopping for gas. Using just one camera, intuVision VA Traffic was able to count vehicles going past the gas station as well as those entering, to determine the efficacy of signage, promotions, and other factors in vehicle capture rate.
Because of the limitations of camera placement at the gas station, and the requirement that both counts be determined from one camera view, many other analytics on the market did not meet the customer's accuracy requirements. However, intuVision VA Traffic, with our robust object detection and tracking, was able to obtain accurate counts, despite traffic conditions. A red light at the end of the street caused frequent stop-and-go traffic conditions, with vehicles traveling very close together.
As you can see from the below video - we are able to track, and accurately count, traffic both when vehicles are moving quickly past the camera, and when traffic slows down and vehicles are close together. Everything from motorcycles, passenger vehicles, and trucks and busses is counted accurately, with additional options for classification amongst these different vehicle types.
The data which was collected was then used to generate reports from within intuVision VA, from bar charts to pie graphs easily showing the comparison between vehicles entering and those leaving. Across most time periods, approximately 10‰ of vehicles passing by enter the gas station.
If you think that intuVision VA can help you or your customers, or are interested in testing our new release, you can reach us here.

© Copyright 2006-2026 intuVision, Inc. All Rights Reserved. intuVision is registered in the U.S. Patent and Trademark Office.