Products
Solutions
Partners
Support
About
Use Case Videos

intuBlog

(781) 497-1015

intuBlog - Series on Review Application - Reports View

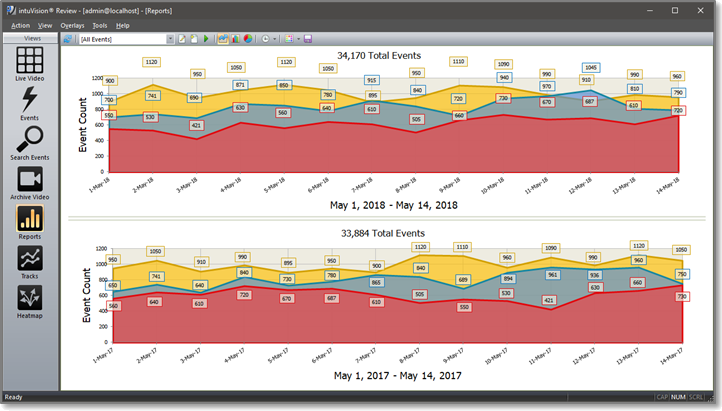
A comparison line graph over two time periods, showing how the customer traffic compares this year to last.

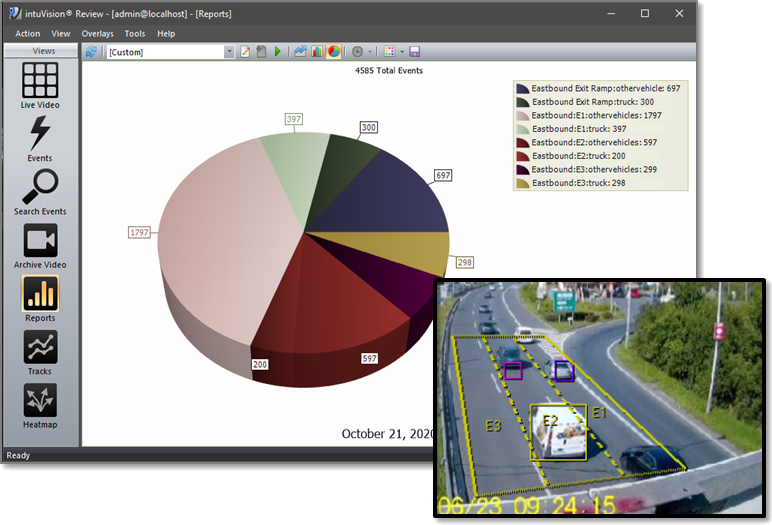
Vehicle counting and classification on three lanes of a highway, to show a comparison of the total numbers of trucks and passenger cars in each lane.

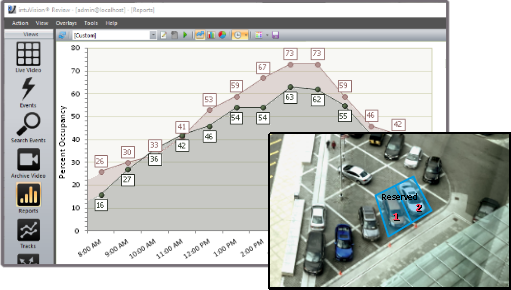
A parking duration report of two reserved spots over a 1 day period.

Home

Review Application Spotlight: Reports View

Anna Vacha

User Facing Components Overview >

Review Spotlight: Intro > Live View > Events View > Search Events View > Archive Video View > Reports View > Tracks & Heatmap View

Welcome to the next in our blog series featuring the user facing components of intuVision VA.

As covered in the intro blog post - the intuVision Review Application is the primary tool for seeing the analytics in action; reviewing live and recorded video; and generating reports, heatmaps, and tracks of objects and events in your scene. So far we have covered the "Live View", the "Events View", the "Search Event View", and the "Archive Video View" of the Review Application. This post will focus on the "Reports View" feature of the Review Application.

At the highest level, the Reports View lets you see general behavior patterns in your scene and generate reports.

intuVision VA supports multiple report and graph formats to efficiently provide the information of interest. Detected events from any camera, or a group of cameras, over select time periods or object types can be seen; and comparisons can be made for any camera over different time periods.

Report types available include line graph, bar graph, and pie chart.

Reporting features are widely used in data-drive deployments such as those typically found in retail or traffic applications, in order to generate reports of customer counts, and pedestrian or vehicle traffic patterns. Reports also help seeing the general trends in security applications, such as when intrusion alerts are most likely to occur, or to evaluate the efficacy of certain measures on parking infractions.

From seeing average speed over time, to the parking duration in each of your parking spots, intuVision Reporting delves into the information specific to each use case to view the data collected by specific events. intuVision VA report types include:

  • Event Count - standard report type, creates a report based on the number of times each of the selected events has occurred over a time period.
  • Average Activity - available only with "Activity" events, and generally used to monitor crowd status or customer status; this report shows on average how many people or other moving objects of interest were present in the scene over a time period.
  • Average Dwell Duration - available only with "Dwell" events, this report shows how often people were dwelling or loitering in different marked areas. A common use example is to gauge how effective a display is at catching people's attention.
  • Average Parking Duration - available only with "Parking" events, this report shows the average time each parking spot is occupied, indicating general parking distribution, and most frequently used spots, as well as areas of the parking lot used sparsely.
  • Coverage Time - available only with "Activity" events, this report provides the time percentage of activity is present in a scene at different times and can be used to judge how often there are guests at your store - or even coverage time of your employees at their station.
  • Merged Event Count - this report indicates how many events are grouped together in a merged events over time. Merged events generate one alarm for multiple instances of an event within a short period of time, for instance in scenes where only one alert is needed for a group intrusion.
  • Parking Duration - available only with "Parking" events, this report gives the duration vehicles were parked in parking spots.
  • Response Time - tied in with our user management tools, this reports average how long staff take to respond and review events as they occur.
  • Speed - available only with "Speed" events, this report provides the average speed of vehicles and other moving objects in the scene over time. As with all reports, this can be further separated by vehicle classification type, for example giving average speed for passenger cars, trucks, motorcycles, etc.

Each of these report types can then be further detailed by camera and event, by object classification, schedule, and more.

intuVision VA Review’s customized query and search parameters include:

  • Camera and Event Name - reports can include all events on a specific camera, events across multiple cameras, selections of specific events, etc. Different event options for the searches include:
    • Alarm and count/aggregate events - even events which do not appear on your event list can be searched.
    • Input triggers - for example input triggers from a card swipe or other exterior data can be searched to verify they are occurring correctly.
    • Compound/Occupancy events - events which aren't connected to a specific camera can be searched directly.
    • Rule groups - in the intuVision Admin, groups of events can be created for easy searching in this page. A good use of this is to view all of the component events, compound events, and input triggers associated with a specific store or intersection.
    • Audit events - system events created when users perform certain tasks within the intuVision system.
  • Aggregate Events Period - data can be aggregated into time periods to see more granular data. Different aggregate periods include: none, 15 minutes, hourly, and daily.
  • Separate Classes - instances of the same event can be reported separately based on the classification of the objects - for instance you can see average speed of different types of vehicles with one event.
  • User - the user who was signed on to the intuVision system when the events were generated. Used primarily for employee audits.
  • Schedule Query - return only events which were generated in a specific schedule - i.e. after hours or during lunch breaks.
  • Query Period - how many days (starting from present time) into the past you would like to query events.
  • Start/End Date - - the specific time period of interest (to the minute).

As you can see, there is a lot of flexibility built into the tool to allow you to quickly and easily see events of interest.

intuVision VA graphs can be formatted in a variety of color schemes for clarity and then exported as an image or PDF files. Using the "Search Event View" this data can also be exported as a CSV file to be ingested into your other reporting tool if needed.

Finally, custom report templates can be saved with its events, cameras, search criteria, etc. for easy repeated access daily, weekly or monthly.

Keep an eye out for future blog posts in this series, detailing how each of these views and capabilities can work for you!

Check out the intuBlog!