|
Recommend to a Friend
|
intuNews Issue 68
|

|
|
|
|
|
|
|
|

New Dwell and Motion Heatmaps
intuVision VA 13.1, our latest release, now brings you two ways to visualize people and vehicle traffic from your camera views. Compatible with both indoor and outdoor views, heatmaps summarize dwell times and motion patterns in your scene.
|
intuVision® VA 13.1

Video analytics you can depend on
|
|
Motion Heatmaps
Summarize overall motion trends for selected time periods. The motion heatmap is ideal for understanding the traffic patterns in stores, parking lots, or sidewalks and streets.
Dwell Heatmaps Highlight waiting times, and show at a glance where people and vehicles are likely to congregate, such as areas people stop and linger or vehicles idle.
|

|
|
|
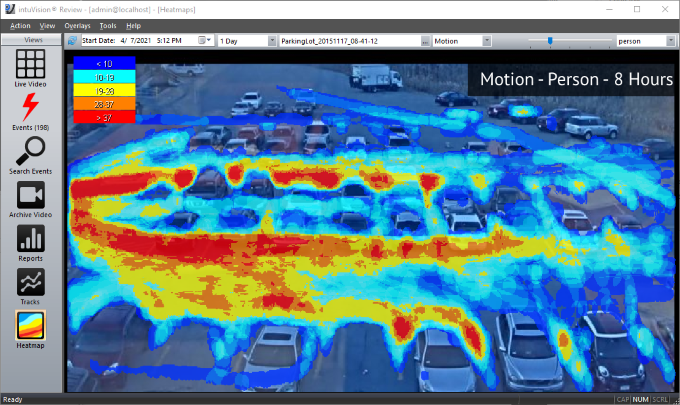
The heatmaps below summarize people and vehicle activity patterns from a parking lot over an 8 hour work day.
|
Motion - Person - 8 Hours
This heatmap shows only person motion. For example, it is evident that people walking from their cars into the building are most likely to walk inside the driveway, with very few taking the safer path along the building. Adding designated walkways would help with this unsafe behavior. Also visible is the common lunch-hour walking path around the outside of the parking lot.
|
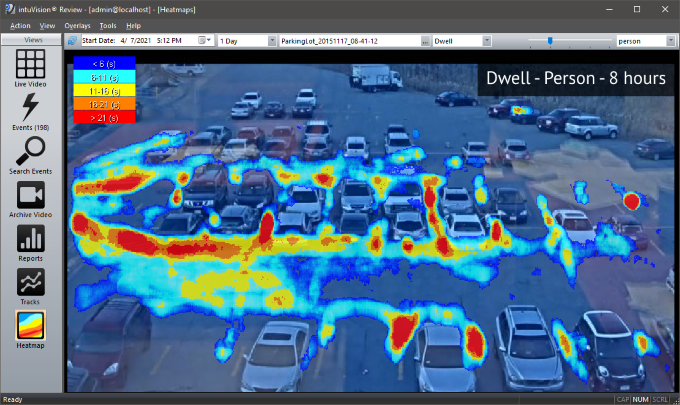
Dwell - Person - 8 Hours
This heatmap shows only person dwell instances for the 8 hours of the test.
Longest person dwell times are beside their vehicles as they go in and out. Parking spots with higher turnover have larger areas of red as more people get in and out of their vehicles. One area of surprise is the large yellow region in the driveway closest to the camera. Looking at archived video of this day indicates that this was caused by a group of people gathering during the lunch hour.
|
|
|
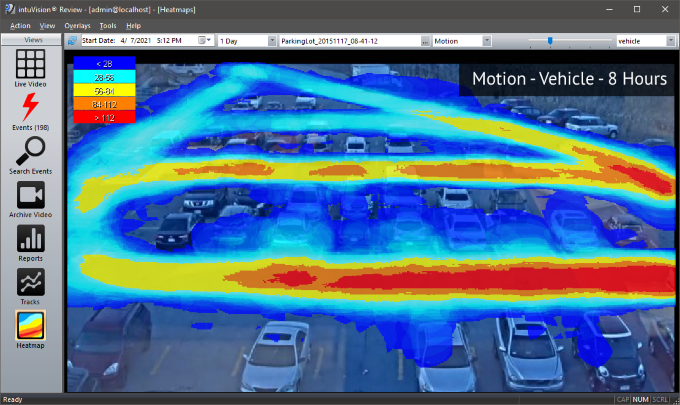
Motion - Vehicle - 8 Hours
This heatmap shows only vehicle motion paths over the course of the work day.
People try to park closer to the building, and so vehicles are most likely to travel along paths closer to the building and the main roadway (both are red). Parking spots with high turnover are marked by light and dark blue, as vehicles move in and out of those spaces during the day.
|
Check out the intuBlog!
If you think that intuVision analytics are the right fit for you or your customers, you can reach us here.
|
|

|